Software Modelling with UML
Software Engineering
(for Intelligent Distributed Systems)
A.Y. 2025/2026
Giovanni Ciatto
Compiled on: 2026-07-05 — printable version
Modelling in Engineering
Architects and civil engineers create models of the things they are going to build
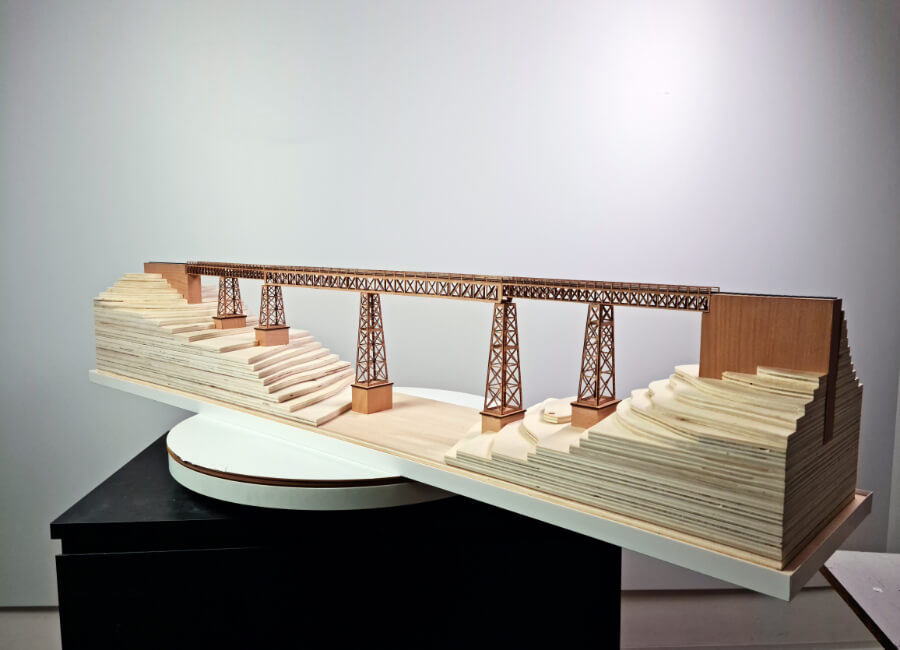 Model of a Bridge
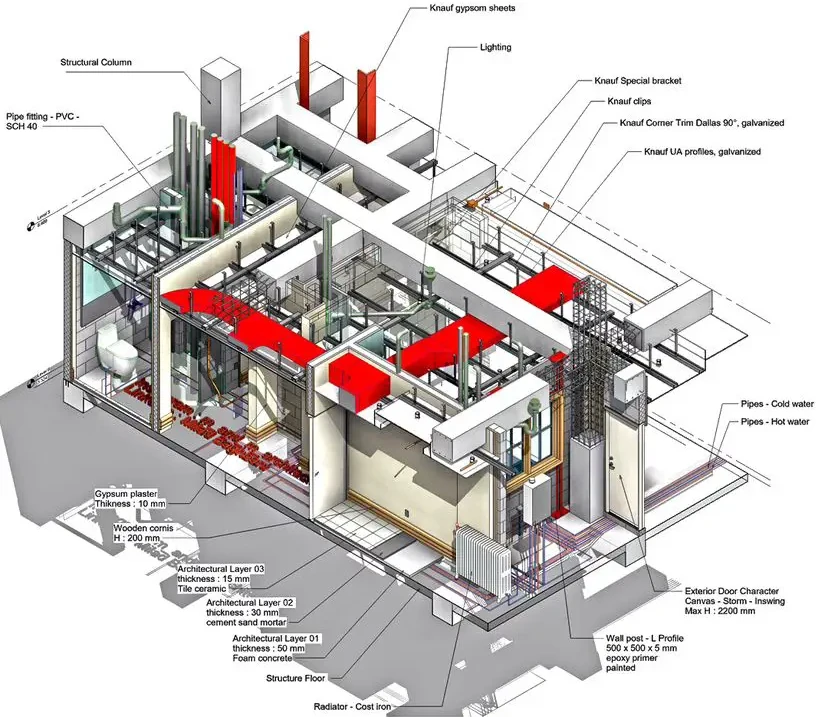
Model of a Building
Model in Statistics / Machine Learning
In statistics (and machine learning) a model is a mathematical representation of a real-world process
(commonly attained by fitting a parametric function over a sample of data describing the process)
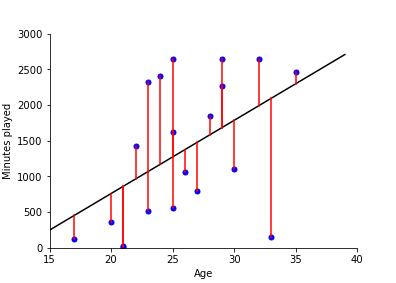
e.g.: $f(x) = \beta_0 + \beta_1 x $ where $f$ is the amount of minutes played, and $x$ is the age
What is a model?
(cf. https://plato.stanford.edu/entries/models-science/)
A model is a simplified representation of something complex
What are models useful for?
-
Understanding of the real world, via simplification and abstraction (i.e., by removing details)
- think about the many models of the atom (Bohr, Rutherford, etc.), or the wooden miniature of a bridge
-
Explain a phenomenon by fitting the model onto the observed data, to reconstruct the process
- think about the attachment theory in psychology
-
Predicting the dynamic behaviour of a system (possibly, before/without building the system)
- think about the weather forecast, or, again, the wooden miniature of a bridge
Models are simplifications
(cf. https://en.wikipedia.org/wiki/All_models_are_wrong)
“All models are wrong, but some are useful” — George Box
- Each model is stressing some aspects of the real world, and ignoring others
- Focus on the purpose and the context of a model:
- if the goal is understanding, the model should be simple and intuitive
- if the goal is prediction, the model should be accurate and precise
Example
- Newton’s Laws: they are not fully correct (Einstein’s relativity refined them)
- but they are still useful for engineering and daily physics
Why do engineers model systems?
-
Models allow engineers to design and study a system before building it
-
Building is commonly more expensive and time-consuming than modelling
-
Models can verify (to some extent) the system they want to create, before fully building it
-
Models allow designers to take design decisions early, and cheaply
-
Models can be used to represent and communicate the design of a system
- useful for collaboration and documentation…
- … which in turn allow new people to join the project
What about software?
-
Writing software implies modelling the world and representing it in a formal way
- so, in a sense, the source code is a model of the world (or, at least, of the problem)
-
Yet, the source code of a project can easily grow in complexity
- think about large projects with millions of LoC:
- how can a person keep them all in their mind?
- how could that person transfer all that knowledge to others?
- think about large projects with millions of LoC:
-
Indeed, as software projects tend to grow complex, the aforementioned motivations for modelling apply to software as well
- we need more abstract (than code) and visual ways to represent software systems
Software systems are commonly modelled using the Unified Modelling Language (UML)
The Unified Modelling Language (UML)
(cf. https://en.wikipedia.org/wiki/Unified_Modeling_Language)
-
General-purpose, graphical, modeling language in the field of software engineering
- intended to provide a (semi)-formal way to visualize the design of a software system
-
UML is a standard (ISO/IEC 19501:2005) managed by the Object Management Group (OMG) since 1997
-
Actually, nowadays, most practitioners do not properly use UML, but instead produce informal diagrams
- more or less inspired by UML, but not strictly following the standard
-
In any case, the focus is on giving a graphical language to represent various aspects of a software system
What can UML represent?
- UML can represent many aspects of a software system, via as many sorts of diagrams
- broadly categorized in structural and behavioural diagrams

- Class Diagrams: overview on the classes and their relationships
- Sequence Diagrams: interactions between objects in a time sequence
- Activity Diagrams: flow of control in a process
- State Diagrams: transitions between states of an object
- Component Diagrams: architectural components and their relationships
- Deployment Diagrams: physical deployment of artifacts on nodes
- Use Case Diagrams: actors and use cases they interact with
Class Diagrams
- Modelling the structure of a system
- Focus on classes and their relationships
Class Diagrams Overview
(cf. https://en.wikipedia.org/wiki/Class_diagram)
Class Diagram Example
(Remark: this is not a “good” diagram from a real system, but just an example to show the graphical syntax)
Class Diagram Explained (pt. 1)
-
Focus on classes (here intended as data types)
- report class names
- report sort of classes (e.g.
abstract,interface,enum,class)enums are types whose values are fixed and enumerated
-
Focus on relationships among classes
- inheritance a.k.a. “extends” (solid line with a triangle)
- implementation a.k.a. “implements” (dashed line with a triangle)
- aggregation (solid line with a white diamond): the container may exist without items
- composition (solid line with a filled diamond): the composed entity cannot exist without the component
- association (solid line, with or without arrow): any other relevant sort of symmetric (no arrow) or asymmetric (with arrow) relation
- inheritance a.k.a. “extends” (solid line with a triangle)
Class Diagram Explained (pt. 2)
- Focus on the attributes of each class
- private attributes (beginning with a
-, or red square) - protected attributes (beginning with a
#, or yellow diamond) - public attributes (beginning with a
+, or green square) - abstract attributes (italics)
- static or class attributes (underline)
- fields or properties, i.e. attributes without parentheses (beginning with a unfilled symbol)
- methods or functions, i.e. attributes with parentheses (beginning with a filled symbol)
- private attributes (beginning with a
Class Diagram Explained (pt. 3)
Common questions
- should you include type information in attributes? $\Rightarrow$ not mandatory, but recommended
- should you include visibility information in attributes? $\Rightarrow$ yes
- should you include Python’s underscore prefixes for visibility (
_or__)in the diagram $\Rightarrow$ as you like - should you include all attributes?
- if you’re willing to provide a complete model of the code’s structure $\Rightarrow$ yes
- if you’re willing to provide an overview of the public API $\Rightarrow$ public attributes only
- if you’re willing to an overview of the types $\Rightarrow$ no
Sequence Diagrams
- Modelling the interaction among the components of a system
- Focus on objects / components and their interactions over time
- i.e., who’s sending which message to whom, when
Sequence Diagrams Overview
(cf. https://en.wikipedia.org/wiki/Sequence_diagram)
@startuml hide footbox
actor Actor participant Participant database Database
activate Actor Actor -> Participant: request activate Participant
Participant -> Database: query activate Database
note right of Actor vertical bars represent participants’s control flow, which are synchronous end note
Database -> Database: internal\nprocedure activate Database deactivate Database
Database –> Participant: results deactivate Database
Participant –> Actor: response deactivate Participant
== New situation ==
alt response is ok Actor -> Participant: another request activate Participant
Participant -> Participant: stateless\nprocedure
Participant -> Actor: another response
deactivate Participant
else response has error Actor –> Participant: shut down destroy Participant create participant “Another Participant” as Participant2 Actor –> Participant2: start another participant end @enduml
-
The diagram is vertical, each column corresponds to the life-line of a participant
-
The vertical axis corresponds to time, the lower, the later
-
Participants can be objects or entities of any sort (e.g. OOP objects, infrastructural components, etc.)
- special icons may be used for special participants, such as actors or databases
- participants are assumed to be already up and running at the beginning of the sequence
- yet they can be created and destroyed during the sequence
-
Horizontal arrows represent messages sent from one participant to another
- the label of the arrow is the message itself
- an informal description of the message can be used too, but formal is better
- straight line is for requests, dashed line is for responses
- the label of the arrow is the message itself
-
White vertical bars on a participant’s life-line represent the control flows
- i.e., the participant is active during that time
- this is way to stress the duration of activities
- participants get activated starting to process some received message, deactivated when done
- i.e., the participant is active during that time
-
Branching (if) or loops are represented via ad-hoc frames
-
Double horizontal lines may be used to denote a new interaction sequence
Sequence Diagram Example in OOP (pt. 1)
Visualising the Iterator Pattern (compliant to Python’s iterator protocol)
Classes
class MyIterator:
    def __init__(self, items):
        self.__items = items
        self.__index = 0

    def __next__(self):
        if self.__index >= len(self.__items):
            raise StopIteration
        current_item = self.__items[self.__index]
        self.__index += 1
        return current_item
class MyCollection:
    def __init__(self):
        self.items = []

    def add(self, item):
        self.items.append(item)

    def __iter__(self):
        return MyIterator(self.items)
Sequence described in the diagram
collection = MyCollection()
collection.add("A")
collection.add("B")
collection.add("C")

iterator = iter(collection)
while True:
    try:
        item = next(iterator)
        print(item)
    except StopIteration:
        break
@startuml hide footbox
participant “Client” as Client participant “MyCollection” as Collection participant “MyIterator” as Iterator
== Initialization == activate Client Client -> Collection: add(“A”) Client -> Collection: add(“B”) Client -> Collection: add(“C”)
== Retrieving the Iterator == Client -> Collection: iter() activate Collection create Iterator Collection -> Iterator: Create Instance Collection –> Client: return Instance deactivate Collection
== Iterating Over Elements == loop Client -> Iterator: next() activate Iterator Iterator -> Iterator: Check if more elements alt More Elements Available Iterator –> Client: return Current Item else No More Elements Iterator –> Client: raise StopIteration deactivate Iterator end end destroy Iterator
@enduml
Sequence Diagram Example in OOP (pt. 2)
-
Participants are named after classes, yet they refer to instances of those classes
-
Arrows are named after method calls when possible
-
The following pieces of code are completely equivalent in Python:
iterator = iter(collection)
while True:
    try:
        item = next(iterator)
        print(item)
    except StopIteration:
        break
for item in collection:
    print(item)
Sequence Diagram Example in Distributed Systems
State Diagram
- Modelling the state of an object and the transitions among them
- Focus on classes and how method calls affect their fields/properties
State Diagram Overview
- State diagrams only make sense for mutable entities
- i.e., entities whose state can change over time
- Essentially, they represent finite state machines (FSM)
- a.k.a. finite state automata (FSA)
- Boxes represent the different states the modelled system can be in
- further descriptions can be written inside the boxes
- Arrows represent the transitions among the states
- most commonly caused by events
- Initial state is marked by a black dot
- mandatory, unique
- Final state is marked by a circle with a black dot inside
- optional (systems may also not terminate!), unique
- Loops: relevant events leaving the state unchanged
- Arrows are labelled with the event causing the transition
- [optional] + the condition for the transition to happen
- [optional] + the action to be performed upon transitioning
- State descriptions may include entry and exit actions
- and/or permanence conditions for that state
State Diagrams can be arbitrarily abstract / complex (pt. 1)
- Just shows the states and the timed transitions among them
- No explicit names of events
State Diagrams can be arbitrarily abstract / complex (pt. 2)
- Explicit name of event triggering the state transition (e.g.
next) - Explicit permanence conditions for each state (e.g. maximum time in a state)
State Diagrams can be arbitrarily abstract / complex (pt. 3)
- More complex diagram, also modelling the flashing of the yellow light (via 2 more states)
- Assumes that integer variables are available to count how many times the light has flashed
- Arrows contain not only events but also conditions and actions to be performed
State Diagrams can be arbitrarily abstract / complex (pt. 4)
-
Each state has its own internal state machine:
- outer states are states of the traffic light’s colour
- inner states regulate whether the light is on or off (to support the flashing)
-
Each inner state machine has its own initial state
- meaning that switching the next colour $\implies$ implicitly turn on the light
State Diagrams can be arbitrarily abstract / complex (pt. 5)
- More precise design: switching the colour keeps the on/off state of the light unchanged
State Diagram Example in OOP
Enum for admissible colours
from enum import Enum

class Color(Enum):
    GREEN = 0
    YELLOW = 1
    RED = 2

    def next(self):
        return Color((self.value + 1) % 3)
State Machine for a Traffic Light
class Semaphore:
    def __init__(self):
        self.__color = Color.GREEN
        self.__on = True

    def next(self):
        self.__color = self.__color.next()

    def toggle(self):
        self.__on = not self.__on

    def __str__(self):
        return f'{self.__color} {"on" if self.__on else "off"}'
Time-related code
from time import sleep
from datetime import timedelta, datetime

T1 = timedelta(seconds=10)
T2 = timedelta(seconds=5)
T3 = timedelta(seconds=15)
T_flash = timedelta(seconds=1)

semaphore = Semaphore()
instant_init = datetime.now()
while True:
    for T in [T1, T2, T3]:
        instant_start_period = datetime.now()
        print(datetime.now() - instant_init, semaphore)
        while datetime.now() - instant_start_period < T:
            sleep(T_flash.total_seconds())
            semaphore.toggle()
            print(datetime.now() - instant_init, semaphore)
        semaphore.next()
Output
0:00:00.000006 Color.GREEN on
0:00:01.005111 Color.GREEN off
0:00:02.010381 Color.GREEN on
0:00:03.011538 Color.GREEN off
0:00:04.013307 Color.GREEN on
0:00:05.033300 Color.GREEN off
0:00:06.038391 Color.GREEN on
0:00:07.043062 Color.GREEN off
0:00:08.048151 Color.GREEN on
0:00:09.051959 Color.GREEN off
0:00:10.057036 Color.GREEN on
0:00:10.057134 Color.YELLOW on
0:00:11.062204 Color.YELLOW off
0:00:12.065133 Color.YELLOW on
0:00:13.069653 Color.YELLOW off
0:00:14.074754 Color.YELLOW on
0:00:15.077038 Color.YELLOW off
0:00:15.077119 Color.RED off
0:00:16.080739 Color.RED on
0:00:17.085859 Color.RED off
0:00:18.090981 Color.RED on
0:00:19.096069 Color.RED off
0:00:20.099124 Color.RED on
0:00:21.104888 Color.RED off
0:00:22.106639 Color.RED on
0:00:23.111723 Color.RED off
0:00:24.116843 Color.RED on
0:00:25.118087 Color.RED off
0:00:26.123146 Color.RED on
0:00:27.126476 Color.RED off
0:00:28.128466 Color.RED on
0:00:29.133614 Color.RED off
0:00:30.138698 Color.RED on
Activity Diagram
- Modelling the workflow of one or more processes
- Like a flow chart, but more flexible and richer, and supporting parallelism
Overview on Activity Diagrams
- Activity diagrams can represent socio-technical workflows
- i.e. workflows involving people and machines
- They can represent business processes
- e.g. order processing, customer service, product development
- They can represent software processes
- e.g. an algorithm, a use case, a system operation
- Boxes represent activities, expressed in natural language
- Several control structures are supported:
- sequence (straight arrows): one activity follows the other
- choiches (diamonds): a branch in the workflow
- based on a condition
- loops (back arrows): a cycle in the workflow
- forks (black bars, opening): activities are started in parallel
- joins (black bars, closing): activities are joined
- joining an activity $\equiv$ waiting for its termination
- Two sort of joins:
- AND join: all activities must terminate
- OR join: at least one (i.e. “any”) activity must terminate
- Beginning and termination $\leftrightarrow$ explicit bullets
Example: Activity Diagram To Represent Algorithms
def bubble_sort(xs):
    xs = list(xs)
    n = len(xs)
    for i in range(n):
        for j in range(0, n - 1 - i):
            if xs[j] > xs[j + 1]:
                xs[j], xs[j + 1] = xs[j + 1], xs[j]
    return xs
Example: Activity Diagram To Represent User Stories (pt. 1)
User Story: Creating & Shares a story on Instagram
As a: social media user, I want to: create and share a temporary story on Instagram, so that: I can share moments, updates, or engage with my followers in a fun and interactive way.
Acceptance Criteria
- Accessing the Story Feature
- Given that I am logged into Instagram,
- When I tap on my profile picture or the “+” icon at the top of my feed,
- Then I should be taken to the story creation interface.
- Capturing or Uploading Content
- Given that I am on the story creation screen,
- When I take a photo/video using the camera or upload media from my gallery,
- Then the selected media should appear as a preview for editing.
- Editing the Story
- Given that I have added media to my story,
- When I tap on editing options (stickers, text, drawings, filters, or music),
- Then I should be able to customize my story before posting.
- Adding Interactive Elements
- Given that I am editing my story,
- When I choose elements like polls, Q&A, links, or mentions,
- Then they should be added to my story for engagement.
- Sharing the Story
- Given that I have finalized my story,
- When I tap on “Your Story” or “Close Friends,”
- Then my story should be successfully shared and visible to my selected audience.
- Viewing Story Engagement
- Given that my story is live,
- When I check my story views,
- Then I should be able to see who has viewed and interacted with my story.
- Deleting or Archiving the Story
- Given that my story is posted,
- When I tap on my story and select the delete or archive option,
- Then I should be able to remove or save it before it expires.
Example: Activity Diagram To Represent User Stories (pt. 2)
Other relevant UML Diagrams by Example
Use Case Diagram
Modelling the actors interacting with a system and the use cases they can perform

(cf. https://en.wikipedia.org/wiki/Use_case_diagram)
- Stick figures represent the actors
- a.k.a. the personas interacting with the system
- i.e. sorts of users in the eyes of the system
- a.k.a. the personas interacting with the system
- Ovals represent the use cases
- i.e. the functionalities the system provides
- Lines associate actors to use cases
- i.e. how actors contribute to each use case
- Dashed arrows represent the generalization relationship
- i.e. how a use case is a specialization of another
- The system is represented as a box
- containing the use cases
Deployment Diagram
Modelling the physical architecture (a.k.a. infrastructure) of a system

- Outer blocks represent the nodes (a.k.a. devices) of the system
- e.g. servers, PCs, smartphones, IoT devices
- Intermediate blocks represent the software components of the systems
- e.g. Web Server, Web Browser, DBMS technology, etc.
- Inner blocks represent the components (a.k.a. software artifacts) of the system
- e.g. Jars for Java software, Python modules, etc.
- Lines represent communication paths
(cf. https://sparxsystems.com/resources/tutorials/uml2/deployment-diagram.html)
Package Diagram
Model the structure of a system in terms of packages (a.k.a. namespaces)
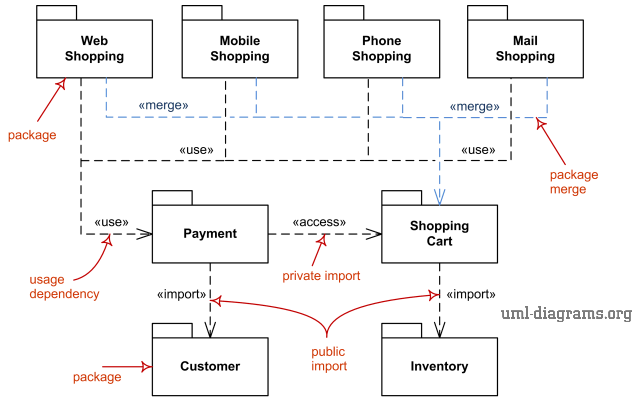
-
Packages represent namespaces or folders in the codebase
- possibly, containing the classes or objects
- but also abstract concepts like “functionalities”
- possibly, containing the classes or objects
-
Lines represent the dependencies among packages
- i.e. how a package uses another
-
Useful to provide a map about the code organization
Mixing Class and Package Diagram
- Common practice, despite not official
- Useful to show how classes are grouped in packages
How much details should I put in a diagram?
-
Enough to convey the essential information
- but not too much to make it unreadable
-
Think about the reader and what they need to know
- e.g. a developer needs more details than a manager
-
When presenting, consider following the C4 approach, which suggests zooming-in from high-level to low-level details:
- Context: high-level overview (e.g. via use case diagram)
- Containers: overview on the main containers (e.g. deployment diagram)
- Components: detailed view on the components (e.g. package diagram, components diagram)
- Code: the actual code (e.g. class diagram)
-
When designing, you may proceed (this is highly subjective, find your way!):
- outside-in: deployment $\rightarrow$ package $\rightarrow$ class
- inside-out: class $\rightarrow$ package $\rightarrow$ deployment
- in either cases:
- start with use cases to design the functionalities, and the actors involved in the system
- use sequence diagrams to design how components/classes _interact
- use state diagrams to design how stateful components/classes work
- use activity diagrams to design the workflow of the system
PlantUML: https://plantuml.com/
-
Technology for generating UML diagrams (in either
.pngor.svgformat) out of a simple declarative language -
Online documentation (useful to learn the declarative language from examples):
-
Online editor: https://www.plantuml.com/plantuml/uml
-
assigning embeddable URLs to your diagrams (e.g., as images in Markdown documents):
 -
the string
SoWkIImgAStDuNBAJrBGjLDmpCbCJbMmKiX8pSd9vt98pKi1IW80encodes the diagram’ content- URL
http://www.plantuml.com/plantuml/svg/ENCODED_DIAGRAM_STRINGwill return the diagram as an SVG image - URL
http://www.plantuml.com/plantuml/png/ENCODED_DIAGRAM_STRINGwill return the diagram as a PNG image - URL
http://www.plantuml.com/plantuml/uml/ENCODED_DIAGRAM_STRINGwill open the PlantUML editor with the diagram
- URL
-
PlantUML Diagrams Examples: Class Diagrams (pt. 1)
enum Status {
  + MISSING
  + AVAILABLE
  + BORROWED
  + LATE
}

abstract class LibraryItem {
    - __id: str
    + title: str
    + author: str
    + state: Status
    + {abstract} get_info() -> str
    + front: Page
    + back: Page
}

interface Borrowable {
    + borrow(member: Member) -> bool
    + return_item() -> bool
}

class Book extends LibraryItem {
    - __isbn: str
    + genre: str
    + get_info() -> str
}

class Magazine extends LibraryItem {
    - __issue_number: int
    + category: str
    + get_info() -> str
}

Borrowable <|-- LibraryItem

class Library {
    - __items: list[LibraryItem]
    + add_item(item: LibraryItem) -> None
    + remove_item(item: LibraryItem) -> None
    + find_item(title: str) -> LibraryItem
}

Library "1" o-- "0..*" LibraryItem : manages

class Loan {
    + item: LibraryItem
    + due_date: str
    + renew() -> bool
}

Loan "1" -- "1" LibraryItem

class Page {
    + content: str
}


LibraryItem "1" *-r- "2" Page

LibraryItem -l- Status
PlantUML Diagrams Examples: Class Diagrams (pt. 2)
PlantUML Diagrams Examples: Sequence Diagrams (pt. 1)
hide footbox

participant “Client” as Client
participant “MyCollection” as Collection
participant “MyIterator” as Iterator

== Initialization ==

activate Client
Client -> Collection: add(“A”)
Client -> Collection: add(“B”)
Client -> Collection: add(“C”)

== Retrieving the Iterator ==

Client -> Collection: iter()
activate Collection
create Iterator
Collection -> Iterator: Create Instance
Collection –> Client: return Instance
deactivate Collection

== Iterating Over Elements ==

loop
    Client -> Iterator: next()
    activate Iterator
    Iterator -> Iterator: Check if more elements

    alt More Elements Available
        Iterator –> Client: return Current Item
    else No More Elements
        Iterator –> Client: raise StopIteration
        deactivate Iterator
    end
end
destroy Iterator
PlantUML Diagrams Examples: Sequence Diagrams (pt. 2)
Check your understanding
- What is a model? What are the potential purposes of a model?
- How can software be modelled?
- What is UML?
- In the context of UML, what are class diagrams? What do they model? How?
- In the context of UML, what is the difference between aggregation and composition?
- In the context of UML class diagrams, what are the possible relations among classes?
- In the context of UML, what are sequence diagrams? What do they model? How?
- In the context of UML, what are state diagrams? What do they model? How?
- In the context of UML, what are activity diagrams? What do they model? How?
- In the context of UML, what are use case diagrams? What do they model? How?
- In the context of UML, what are deployment diagrams? What do they model? How?
- In the context of UML, what are package diagrams? What do they model? How?
- What is PlantUML?
Lecture is Over
Compiled on: 2026-07-05 — printable version